
Use this to select different options to be used in constructing regression trees.
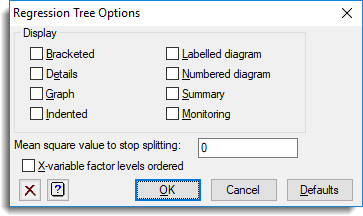
Display
Specifies which items of output are to be displayed in the Output window.
| Bracketed | Display as used to represent an identification key in “bracketed” form (printed node by node). |
| Details | Gives detailed information about the nodes of the tree |
| Graph | Plots the tree |
| Indented | Display as used to represent an identification key in “indented” form (printed branch by branch) |
| Labelled diagram | Diagrammatic display including the node labels |
| Numbered diagram | Diagrammatic display with the nodes labelled by their numbers |
| Summary | Summary of the properties of the tree |
| Monitoring | Information monitoring the construction process. |
Mean square value to stop splitting
Specifies the limit on the mean square of the observations at a node at which to stop making splits.
X-variable factor levels ordered
Specifies whether the x-variable factor levels are ordered.