
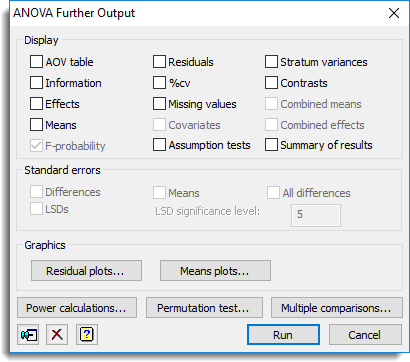
Display
You can select additional statistics and other output to be displayed following an Analysis of Variance. Depending on how the design was specified, some or all of the following options may be available:
| AOV table | Analysis of variance table. |
| Information | Details of large residuals, non-orthogonality and any aliasing in the model. |
| Effects | Tables of estimated treatment parameters. |
| Means | Tables of means for treatment terms. |
| F-probability | F-probabilities for the analysis of variance table. |
| Residuals | Tables of estimated residuals. |
| %cv | Coefficients of variation and standard errors of individual units. |
| Missing values | Estimates of missing values. |
| Covariates | Estimates of covariate regression coefficients. |
| Assumption tests | Displays tests for homogeneity, normality and stability tests (not unbalanced treatment structure). See ACHECK procedure for details of the tests that are performed. |
| Stratum variances | Estimated variances of the units in each stratum. |
| Contrasts | Estimated contrasts of treatment effects. |
| Combined means | Means for treatment terms combining information from all the strata in which each term is estimated. |
| Combined effects | Estimated effects of treatment terms combining information from all the strata in which each term is estimated. |
| Summary of results | A summary of the analysis that gives just the significant treatment effects in a format that would be useful for a report. This uses the ARESULTSUMMARY procedure. |
Standard errors
When printing tables of means you can specify the form in which standard errors will be displayed: as standard errors of the means, standard errors of differences of means (SEDs), or least-significant differences (LSDs). If required, you can print more than one type of standard error. You can specify the significance level for LSDs as a percentage (default 5) in the accompanying field. Note that LSDs cannot be formed for tables combining information over several strata.
Graphics
Following an analysis of variance you can generate residual plots and plots of treatment means.
Power calculations
Lets you calculate the power for an Analysis of Variance.
Permutation test
Lets you perform random permutation tests for an Analysis of Variance. Random permutation tests provide an alternative to using the F-probabilities printed for variance ratios in an analysis of variance table in situations where the assumptions of the analysis are not satisfied.
Standardization method (Unbalanced design only)
Allows you to specify the method used to standardize the table of means. The Marginal option standardizes the table of means by weighting by the number of observations within each level of the factor(s). Equal standardizes by having equal weight for each of the levels of the factor(s). The Observed option uses the observed counts in each cell of the table for the weightings.
Factor combinations for means (Unbalanced design only)
For an unbalanced design the tables of means are calculated using the PREDICT directive. The first step (A) of the calculation forms the full table of predictions, classified by every factor in the model. The second step (B) averages the full table over the factors that do not occur in the table of means. This option specifies which cells of the full table are to be formed in Step A. The default setting, Estimable, fills in all the cells other than those that involve parameters that cannot be estimated, for example because of aliasing. Alternatively, the setting Present excludes the cells for factor combinations that do not occur in the data.
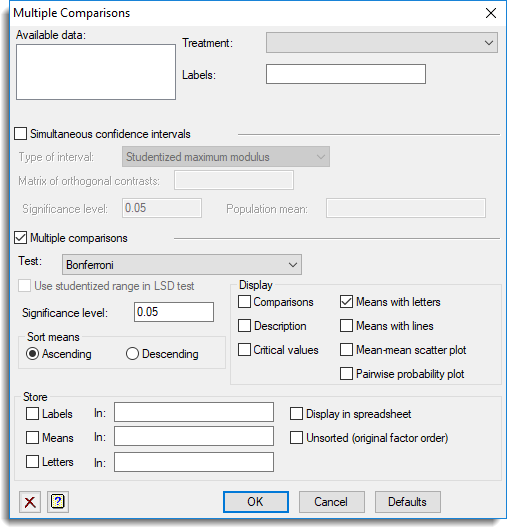
Multiple comparisons
This button will open the Multiple Comparisons menu which lets you request output of multiple comparison tests and simultaneous confidence intervals.
This option is only available if the option Show multiple comparisons on menus has been enabled on the Tools | Options | Menus tab.
See also
- Residual Plots dialog.
- Means Plots dialog.
- Multiple Comparisons menu for specifying multiple comparisons.
- Permutation Test menu performing random permutation tests.
- Power for ANOVA menu to estimate the power of the analysis of variance.
- ACHECK procedure for checking assumptions for an analysis of variance.
- ARESULTSUMMARY procedure for a summary of the results.